The Boston Planning & Development Agency (BPDA) has long kept 3D models of its city. However, cobbled together over the years, the files are at times cumbersome and as firms increasingly turn to 3D printing for model making and testing, not so useful. Printers don’t know how to process them or they are not designed in a way that print with stability. MakeTANK, an initiative of the Boston Society of Architects (BSA) saw this as an opportunity.
MakeTANK was initially started to “integrate maker culture into the design process,” according to Sasaki director of technical resources Bradford J. Prestbo, who has been intimately involved with the project along with the rest of the firm. The hope was to leverage the many makers and maker spaces in the greater Boston area, and help architects increase client engagement and decrease contractor risk—and cost—by testing their designs out first. “Imagine going into a restaurant where the chef only wrote recipes and has never actually cooked them,” said Prestbo, half-joking. “That’s kind of like the architectural profession today, where we just do a lot of paper architecture and paper designs without going through the process to actually taste what we’ve coupled together to make sure it’s actually an effective solution that also will perform long term.”
City Print is MakeTANK’s latest project, just announced at ABX19, though it’s been under development for over a year. The collaborative team of architects that came together for City Print developed a series of scripts that helped turn the existing models of Boston into “watertight solids,” meaning that when processed in Grasshopper they can be effectively fed into 3D printers. They also added additional topographic details. The process, however, could not be fully automated.
The files have to be individually opened, the scripts ran, and all of it double and triple checked for quality control. To help convert the over 200 model tiles of the city to be 3D ready, MakeTANK has enlisted the “who’s who” of Boston-area architects. “We are engaging in the greater AEC community to help us process the tiles,” explained Jay Nothoff, Sasaki fabrication studio manager, “and then turning around and handing this resource back to that same community as a finished project for everyone to enjoy and use as they will further project work.”
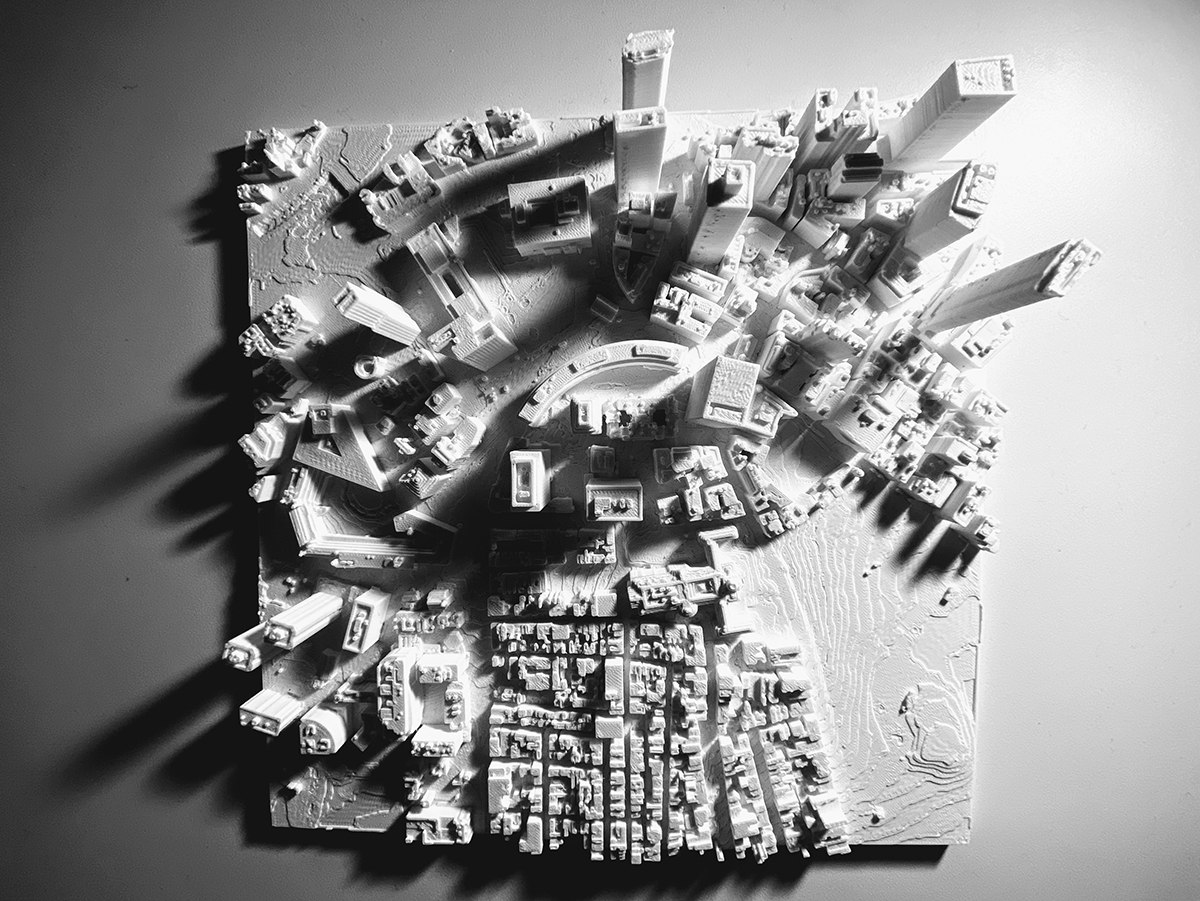
The revamped models will be added to the BPDA’s free repository and the BSA is using them themselves. They’ll be replacing their lobby’s current scale model of the city—the basis of which was originally designed in the 1980s and is mostly focused on the financial district—with a new, modular replica made from these printed files. “We’re zooming out from the financial district,” said Nothoff. “We’re including the City of Boston in its entirety and we’re making a model that is easily updated because it is built off a grid system. As portions of the city change and grow, these titles are semi-precious at best; they’re just going to be held in place with magnets so we can pull the tile and put a new one in its place to most accurately represents the City of Boston in its current state.”
Felipe Francisco, an architectural designer at Sasaki, went on to explain that many community groups didn’t feel represented by the previous BSA model. “We’re open to try and create a new dialogue with those groups,” explained Francisco. “We want to use this as a resource for community groups to be able to come in and use this model to diagram stories over it through projection mapping about their communities.” By collaborating with visualization experts, the BSA is developing tools to use the re-built model as a storytelling and visualization device. “The intention is to build a base projection for the model itself that delineates roads, waterways and what have you,” said Nothoff. On top of that could be layered information on sea-level rise, income data, other metrics, or more abstract visuals. “We’re reaching out to various organizations throughout the greater Boston area, such as the Boston Foundation, to help us gather all the voices that are currently feeling underrepresented and give them equity with his model and teach them how to use the projection map on to the model and tell their story.”
The process is ongoing. Interested area firms can “check out” tiles from a grid of the city, and for a dose of healthy competition, check out a leader board. “You grab a tile, fill out a form, and submit it and shortly thereafter you get all the support files and the working files and scripting as well as instructions on how to process them,” explained Prestbo.